Every claimed parcel on the record, not just the sampled ones.
Subsidy Monitoring checks each claimed parcel against what the satellite saw on it through the claim season, and hands you an exception list instead of a sampling round.
- GSD
- Wide / 10–30 m
- Cadence
- Season long
- Platform
- Wide-swath satellite
- Spectral
- Multispectral
Where the sample runs out
Claims close, the sample is drawn, and the inspectors go out to the parcels in it. Each visit gives you a measured parcel and a recorded finding, and the round as a whole gives you a read on the claim population.
What it cannot give you is anything about the parcels that were not drawn. Those are paid on the declaration. The rest of the list gets no check at all, and the only view you have of it is an extrapolation from the ones you did see.
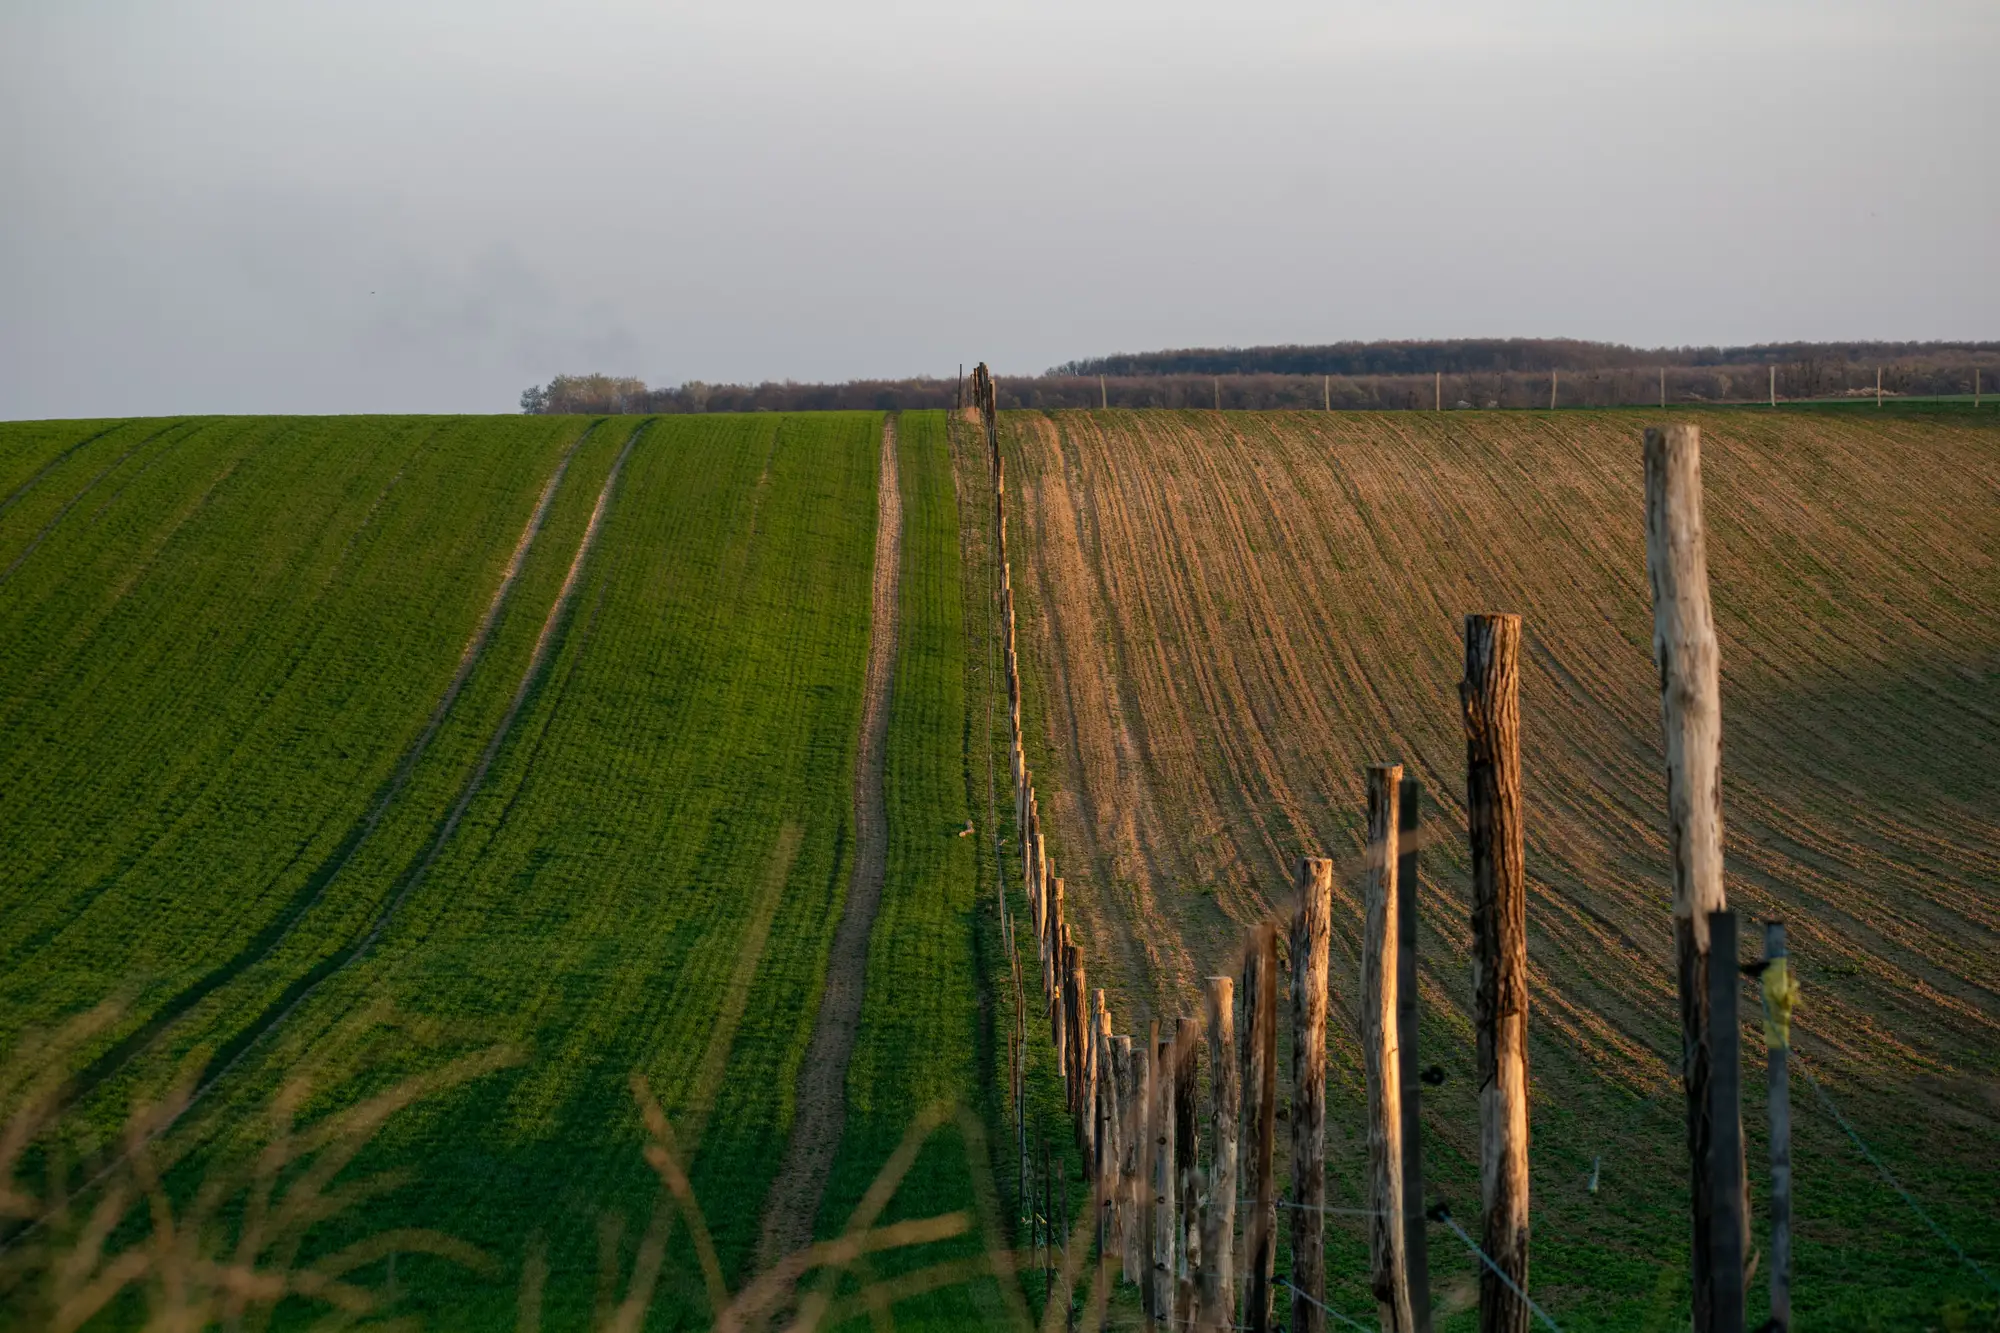
The claim season, step by step
| Step | The sampled round | With Subsidy Monitoring |
|---|---|---|
| Choosing what gets checked | A sample is drawn from the claims, part random and part by risk rules, and inspectors are booked against it. | Every claimed parcel in the payment year is checked. You load the claimed boundaries and the whole list is covered. |
| Still yours The risk rules for picking which flagged parcels get a visit. | ||
| Reading the claim against the ground | The inspector visits, measures the parcel and compares the declared use with what stands on it. | Observed land cover for each parcel is classified from multispectral passes across the season and compared with the declared use. |
| Timing | A visit shows the parcel on one day. | Each parcel has a season timeline, so you can see what it looked like at each pass, not only on the day someone arrived. |
| Finding the mismatches | Non-conformities turn up in the sampled parcels, and the picture for the rest is an extrapolation from them. | The exception list names the parcels, among all of those claimed, where observed land cover does not match the claim. |
| Building the case file | The inspection report, measurements and photos from the visit. | A CSV by parcel ID, the map layer and the season timeline sit in the file alongside them. |
| Deciding what a flag means | The inspector's finding goes to review, and the agency decides the outcome. | A flag goes to review in the same way. It says the record and the claim differ. It does not say why. |
| Still yours The review, the field visit on a flagged parcel, the non-conformity finding, the claimant's right to respond and the payment decision. | ||
What arrives for a payment year
Every claimed parcel
Full-coverage parcel check
Every parcel you load is checked against its declared use across the season, in place of a drawn sample. It lands as the base of the record for the claim round.
CSV + map layer
Exception list
The parcels where observed land cover does not match the claim, keyed by parcel ID. The CSV joins to your claim table, and the map layer opens in your GIS.
This serves the "Finding the mismatches" row.
Timeline
Season timeline per parcel
What each parcel looked like at each pass through the claim season, so a reviewer can see when it changed and not only that it did.
It serves the "Timing" row.
CSV by parcel ID
CSV export for the case file
The flag, the observed class and the dates of the passes it rests on, ready to attach to the case file.
It serves the "Building the case file" row.
Through the payment year
Load the claimed parcels once, let the season run, and review the list when it comes back. Nothing changes on your side of the claim itself.
Load the claimed parcels
The claimed boundaries for the payment year, with parcel IDs and declared use.
Season coverage
Wide-swath multispectral passes across the claim season, from application through to the last useful pass before payment authorisation.
Observed land cover against the claim
Each parcel's land cover is classified from the passes and compared with what was declared.
Exception list and timelines back
You get the exception list, the map layer and a season timeline for each parcel, ahead of the payment run.

Limits
- What 10–30 m can resolve
- At 10 m a pixel is 10 m across, and at 30 m it is 30 m across. A parcel needs several pixels across to be classified on its own. Field-level land cover is what you get. Narrow strips, very small parcels and the edge of a parcel are not reliably resolved, and plant counts or sub-field boundaries are out of reach.
- Season-long, not weekly
- Passes across the season set the cadence. A change inside the season shows at the next usable pass. There is no live feed.
- Cloud
- Optical passes need clear sky. A clouded pass is filled by the next usable one, so a parcel can go longer between looks than you would like.
- What it cannot see
- Anything not visible from orbit: who works the land, stocking, paperwork. The record covers land cover, and what it means for a condition of the scheme is for your reviewer.
- A flag is not a finding
- The list says where the record and the claim differ. It does not say why, and it does not show intent.
Who it's for
Switch to it if
- You are a compliance auditor or head of inspection at a national paying agency
- There are more claimed parcels than inspectors can visit in a season
- You want a check on every parcel for area-based claims, with the sample kept for the visits
Stick with the sampled round if
- Your parcels are mostly too narrow or small for 10–30 m to read
- You need a finding of non-compliance rather than a review flag
- You need same-week or live monitoring of a parcel
Questions before a payment year
Does this replace our field inspections?
It replaces the sampled round as the way of choosing what gets checked. Inspectors still visit the parcels that are flagged, and what they find is what goes in the file.
How do we check it against our own inspections?
Take a payment year you have already worked, load the claimed parcels, and compare our exception list with the non-conformities your inspectors recorded.
Does a flag mean the claim is wrong?
No. It means the observed land cover and the declared use differ. A reviewer decides what that means.
What happens when a pass is clouded out?
The next usable pass fills the gap. A parcel can go longer between looks, and a clouded-out stretch is visible on its timeline.
What do we send and what comes back?
The claimed parcel boundaries, with parcel IDs and declared use. You get the exception list, the map layer and a season timeline for each parcel.
Will it fit our LPIS and case system?
Files come back keyed by parcel ID, so they join to your claim table. We don't write into your LPIS or case system.
Who owns the imagery and the results?
Ownership and licence terms are agreed in writing when you get started. If your legal team needs them earlier, ask.
How is it bought and priced?
Pricing is agreed when you get started. Tell us roughly how many parcels you administer and we'll take it from there.
Put this season's claims on the record.
Send us the claimed parcels for a payment year you've already closed. We'll show you what the exception list looks like next to your inspection results.